Amazon Seller Central
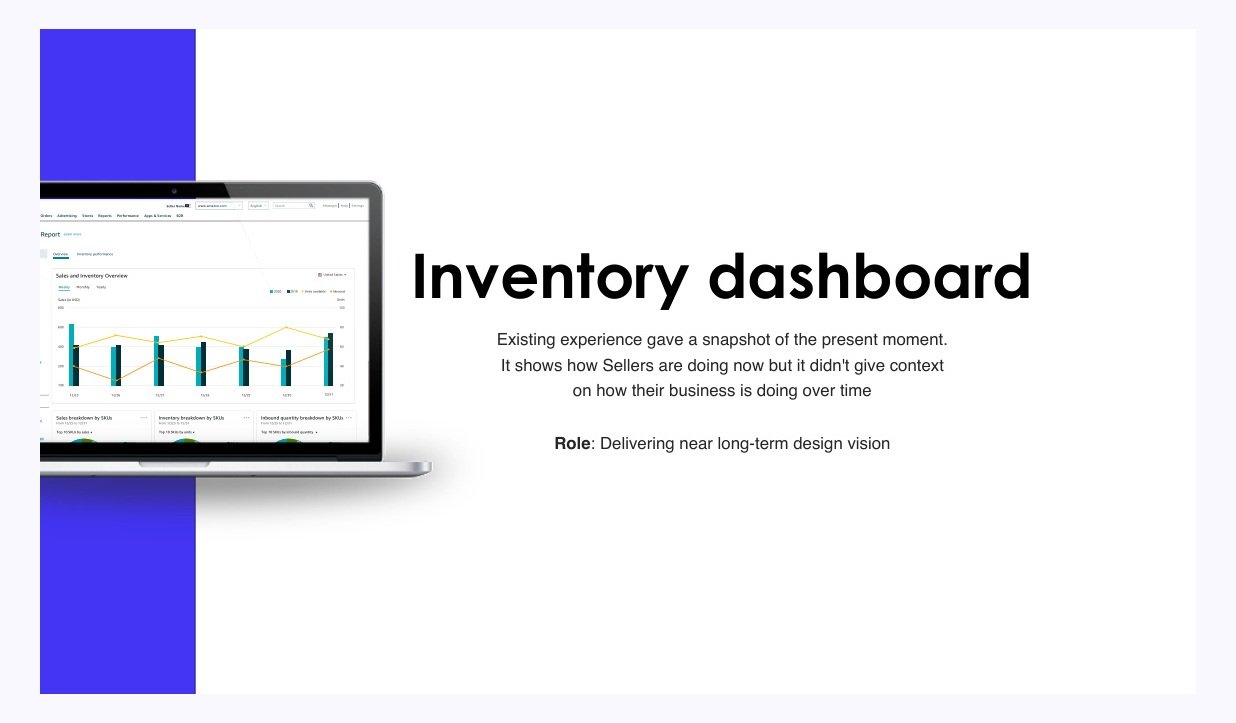
Leading research and vision work to help sellers understand payments, inventory, and business performance with more confidence.
Across Seller Central, the challenge was not a lack of data. It was that important decisions were scattered across reports, tools, terminology, and workflows that sellers had to stitch together themselves.
My work spanned detailed user research on the Seller Central payments experience and a near-to-long-term vision for inventory analytics. In both cases, the role of design was to uncover gaps, name the right opportunities, and help sellers move from raw information to clearer action.
Product question: How might we help sellers understand what is happening in their business without forcing them to become analysts, accountants, or workflow detectives?
Two connected opportunity spaces
Led detailed research into the Seller Central payments experience to uncover confusion, gaps, and opportunities for clearer financial understanding.
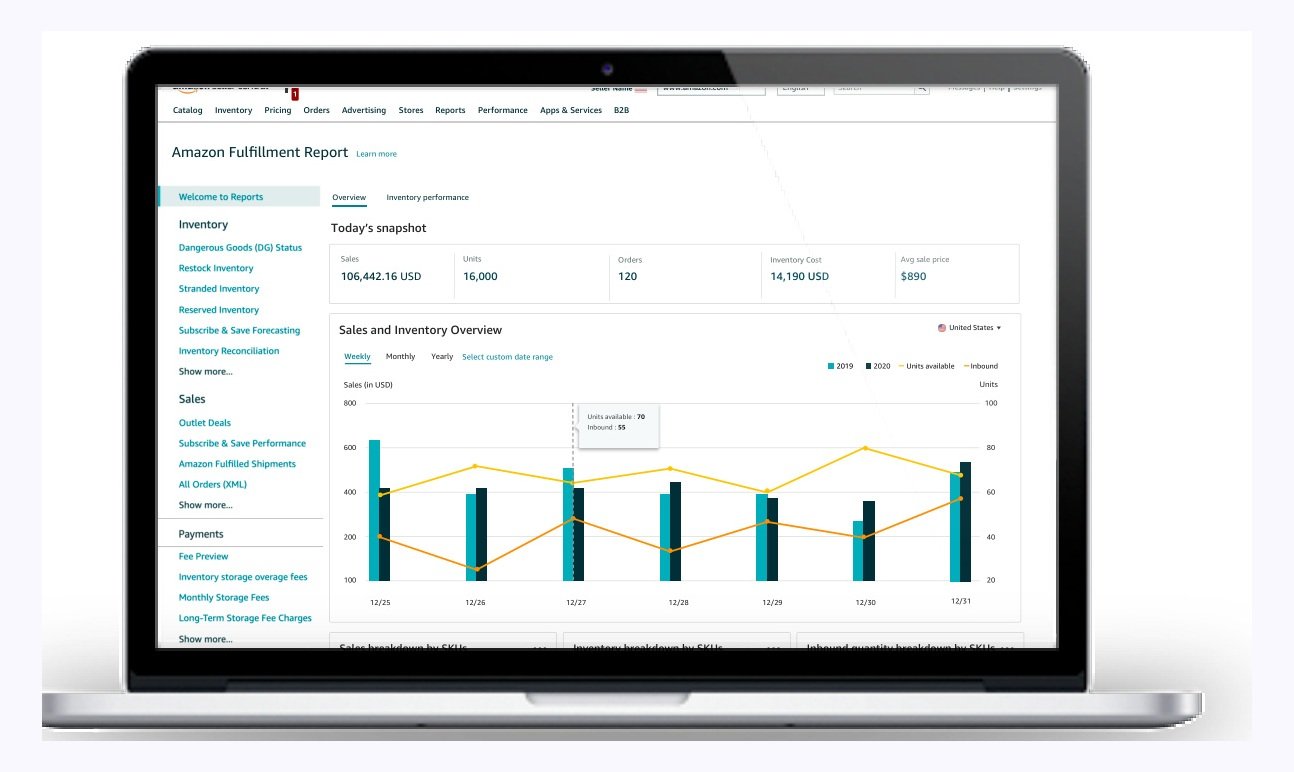
Created a dashboard vision that helped sellers understand sales, inventory health, SKU performance, and business trends over time.
Both streams pointed to the same need: make complex business systems easier to interpret, trust, and act on.
Researching Seller Central payments
The payments research looked closely at how sellers understood money movement, reconciliation, account health, and the moments where the system failed to explain itself. The goal was to find the gaps that created avoidable support needs, mistrust, or manual work.
That research helped identify opportunity areas: clearer payment status, better terminology, stronger explanation of deductions or adjustments, and more actionable paths when something looked wrong.
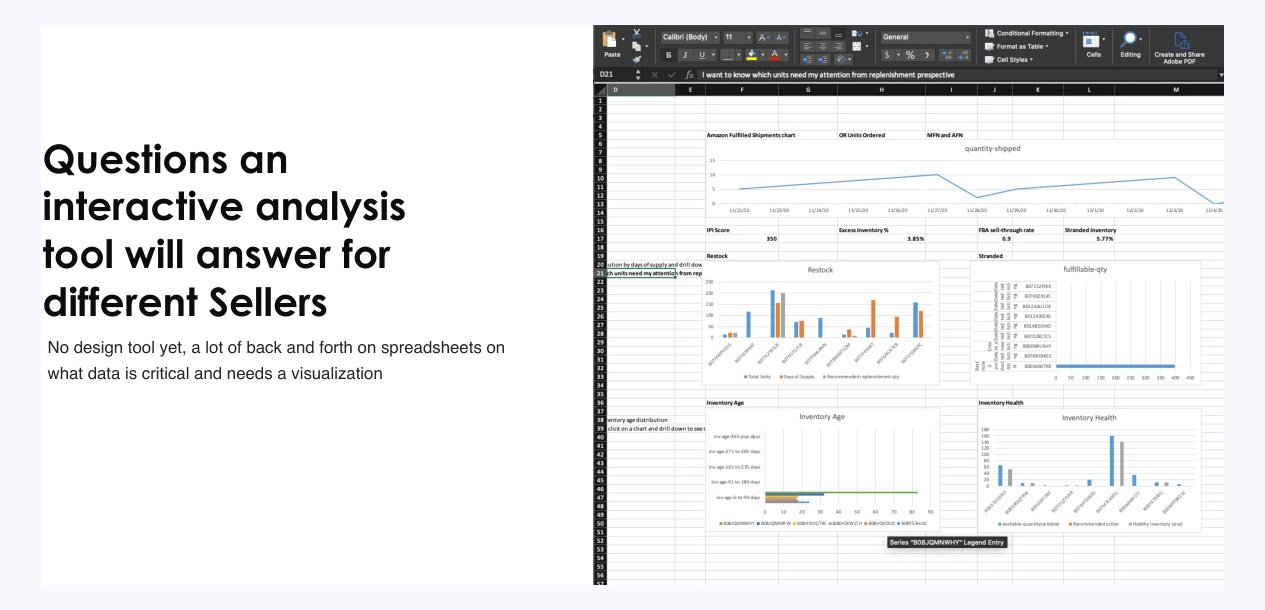
The questions the dashboard needed to answer
Getting the right experts in the room
For the inventory dashboard work, I brought partner product and design teams together to discuss KPIs, seller questions, and the kinds of decisions a future dashboard should support. Before the dashboard became a design artifact, it was a shared model of what sellers needed to understand.
We worked through sales vs. inventory, inventory health, SKU data, trend views, and drill-down moments. A lot of the early alignment happened in spreadsheets before it became interface design.
Used payments research to identify where sellers lacked clarity, confidence, or a clear next step.
Brought product and design partners together around KPIs, seller roles, and decision questions.
Created a near-term and long-term dashboard direction within a narrow timeframe.
Moved from static reports toward trend, drill-down, and inventory-health views.
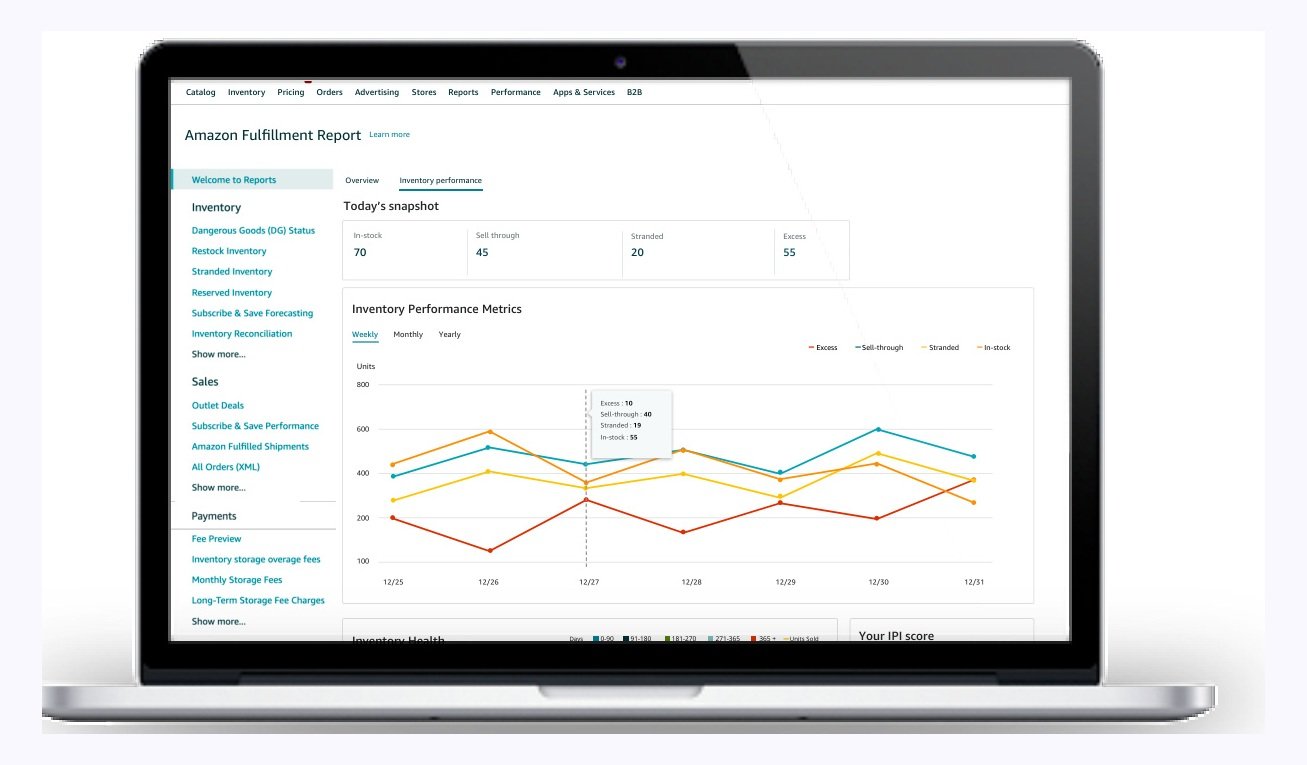
The design challenge was not making more data visible. It was helping sellers know what deserved attention—and what to do next.
Impact
The work created stronger opportunity framing across Seller Central payments and inventory analytics.
The payments research clarified where sellers lacked confidence around money movement, reconciliation, terminology, account health, and next steps.
The inventory dashboard work moved reporting from static downloads toward trends, drill-downs, inventory health, and SKU-level action.
The work gave product and design partners a clearer model for which KPIs mattered and what questions the experience needed to answer.
Learnings
More charts do not automatically help sellers. The experience has to guide attention toward what changed, why it matters, and what to do next.
The payments work showed that detailed UX research can identify product opportunities, not just usability issues.
Analytical, executive, and operational sellers needed different entry points into the same business truth.